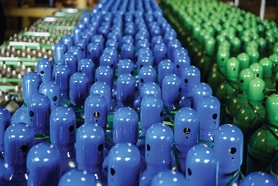
Chart Industries financials show order levels above $60m
Chart Industries, Inc. has reported its results for the third quarter ended 30th September 2017, including an added $6.1m in sales and 20% operating income margin from the completed Hudson acquisition.
Net income for Q3 of 2017 was $1.5m and total sales for Q3 of 2017 increased to $240.5m from $238.2m in the second quarter of the year.
Market and order activity continues to increase year to date, with $258m in orders received in the quarter, inclusive of $3.8m of orders from Hudson in the ten-day Chart ownership period. Energy and Chemicals (E&C) orders in both the third quarter and the second quarter of 2017 were above $60m, and BioMedical orders were up 7.3% sequentially over the second quarter of 2017 driven by demand for oxygen concentrators.
... to continue reading you must be subscribed